My Projects > Project > Site Data > Drone Images
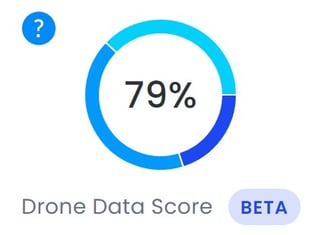
Note: This is a new feature that is still in development. Drone Data Score does not directly correlate with the final model quality. It indicates how close the flight's default parameters were, based on the factors outlined below.
Drone Data Score is only available on small project types as this time and you may see Drone Data Scores as far back as 10/31/2022.
Calculating Drone Data Score
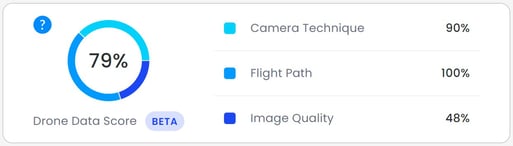
Drone Data Score is based on three key parameters: camera technique, flight path and image quality. Each of these parameters is scored based on its sub-variables outlined below. Then all three of these parameters are averaged together to calculate a Drone Data Score.
Scoring:
- Good: 80 - 100
- Okay: 60 - 79
- Needs Improvement: Below 60
Camera Technique
The Camera Technique parameter scoring can be broken down into two categories; Camera Tilt and Inter-Image Distance. This score accounts for 30% of the Drone Data Score.
Scoring:
- Good: 80 - 100
- Okay: 60 - 79
- Bad: Below 60

Camera Tilt
The ideal camera angle tilt depends on whether the image taken is part of the context or detailed flight.- Context flight: (-35°) - (-50°)
- Detail flight: (-30°) - (-45°)
- Avoid Horizon (0°) or ground shots (-90°)
Inter Image Distance
The distance between image locations and compared against an average inter image distance. 70% overlap to 90% overlap yields the best results.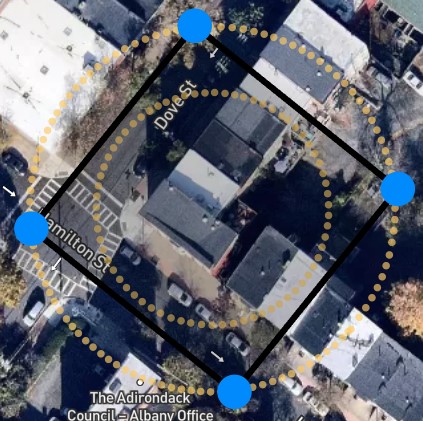
Flight Path
The flight path scoring is broken up between Flight Formation, Context Flight, Detail Flight, Survey Efficiency and Image Count. It accounts for 50% of the total Drone Data Score.
Scoring:
- Good: 80 - 100
- Okay: 60 - 79
- Bad: Below 60
Flight Formation
The idea is to generate an ‘ideal’ flightpath for the scene and compare that to how the flightpath the pilot flew. This presumes an ideal flightpath is possible i.e the scene is without large trees or other obstacles. We advise more circular flightpaths if the scene allows to ensure greater coverage.
Context & Detail Flight
A high score indicates an optimum distance from the center of the house/structure for the detailed and context flightpaths. This is determined based on the bounding box so if the bounding box is improperly placed, it can skew results.
Survey Efficiency
The idea here is to look into whether the pilot flew the flight too fast or too slow. Ideally, flight times should be under 15 minutes.
Image Count
Note: Image count should be used as a general benchmark and is less indicative of an ideal flight compared to the other variables.
Image count assesses the image distribution around the project site based on a bounding box size of ~35k sq. ft. We then compare the actual flight path and image distribution and compare it to our baseline flight path and image distribution to calculate the difference.
Image Quality
Image quality is based on the number of images our image filters catch and remove prior to processing. It is the fraction of 'good' images over the total number of images uploaded. Less than 100 means a more thorough photo review should be conducted before uploading images for processing. This score accounts for 20% of the overall Drone Data Score.
Scoring:
- Good: 100
- Okay: 80-99
- Bad: Below 80
If your Drone Data Score is consistently showing 0% Image Quality, do not fret! This is due to a specific piece of data missing from the image metadata, and will not be a detriment to the model quality.